
Not ready to be public
Sponsors earn their shares by closing a deal, and many bring companies with no product on the market and no cash flow yet. That looks more like a venture bet than an investment.
Most SPACs merge with companies that aren’t ready to be public, and the market knows it: warrants trade for pennies because no one expects the $10 floor to hold. Some SPACs don’t deserve that discount. This is how SPAC Watch tells them apart.
A SPAC raises $10 a share and holds it in trust. That floor protects the shares only until the merger closes. After that, the price is whatever the business is worth.
Sponsors earn their shares by closing a deal, and many bring companies with no product on the market and no cash flow yet. That looks more like a venture bet than an investment.
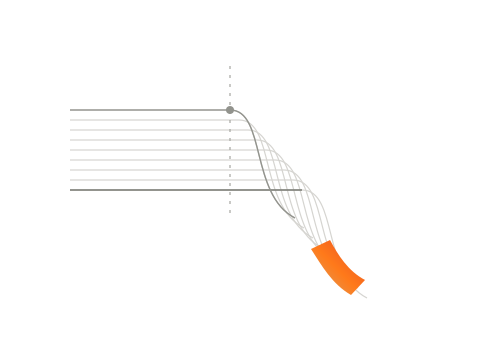
Before the vote, a shareholder can redeem for the $10 in trust. Once the deal closes, nothing holds the price, and too many merged companies slide to $3–$6.
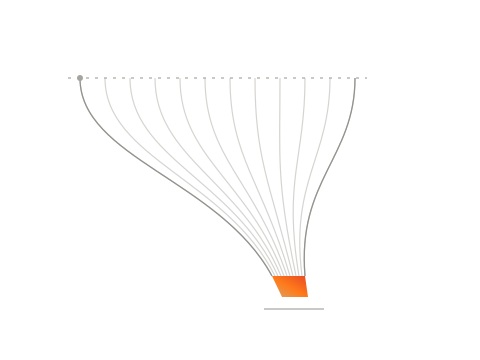
With the shares at $4 and a strike of $11.50, a warrant needs the price to nearly triple. No one expects that, so it trades for cents. For most SPACs the discount is deserved. Not for all of them.
Is the share price backed by assets and cash flow, or by promises? A business that already earns tends to hold its value after the merger, and that gives a warrant something to stand on.
550SPACs graded
Boring on purpose. The share price rests on real assets and cash flow rather than promises: easier to value, harder to disrupt, and less likely to fall far after the merger. That is the cushion a warrant needs.
315SPACs graded
Not a verdict to avoid, but volatile. The value is still a promise — a solid-state battery not yet on sale, a quantum computer, a drug in trials. Without cash flow, the company may not survive the public market long enough to turn a profit. Good for a trade, not for ten years.
539SPACs graded
The trust is still there, but the deadline is close and nothing says a deal will close before it. An extension vote is where holders can redeem the trust empty or vote the SPAC out, and the warrants and rights expire worthless if they do. A Nasdaq deficiency notice or a material weakness can put a SPAC here too. Size and sector never do, and neither does going-concern wording, which nearly every SPAC carries.
70live SPACs
Still alive, and in trouble: more than half the trust has been redeemed, or the shares were struck from the exchange and now trade over the counter, or nowhere at all. The two go together — funds redeem when they expect a delisting. Set by rule from the filings, never by a model. A SPAC that has already liquidated is not counted here — its story is over.
Graded first from the prospectus, then again at every annual report as the trust changes. The 416 liquidated SPACs keep the grade they held. 226 SPACs are unclassified: their filings don’t give enough to judge.
Investment grade or speculative is a judgment about the business a SPAC is looking for, read from its filings. High risk is not: it follows from the deadline and the deal probability, and a rule sets it whatever the model said.
| What is weighed | Pulls a SPAC down | Needed for investment grade |
|---|---|---|
| Size | A trust under $150M is speculative. It trades as a cheap warrant, not as a holding. | About $200M or more — enough to buy an established business. |
| Target industries | Unproven or pre-revenue technology, crypto, cannabis and healthcare are speculative. | Established sectors with steady cash flow: energy, infrastructure, insurance, real estate, logistics. |
| Geography | A focus on Asia, Latin America or another emerging market is speculative. | A focus outside those regions. |
| Sponsor | Earlier deals whose companies went bankrupt or were delisted are speculative, however many there were. Fraud, sanctions or scandal are high risk. | Earlier companies that are still standing. |
| Time left | Past the deadline, under 60 days from it with a deal less likely than not, or under 120 days with a deal probability below 30%: high risk, whatever the grade was. | Nothing. More than six months of runway rules out high risk, but time is not quality. |
Before there’s a target, you’re backing the people who will choose it. One bad deal can be luck. A string of them is a record — and the pricer makes that record part of the warrant’s fair value.
The $3 threshold applies to the post-merger company’s common stock. It is a survival line, not a passing grade. Some viable businesses trade below $5 and still return substantial cash to shareholders. A price below $3 usually means the equity has been decimated. At or above $3 means the deal avoided outright failure, not that it was a good investment.
Being acquired does not automatically make a deal successful. A sale below the same line is treated like any other wipeout. So are liquidation, bankruptcy, a terminated deal, delisting, or a still-searching SPAC whose trust has been largely redeemed.
Each prior outcome that clears the line counts in the sponsor’s favour. Each failure counts against it. A sponsor with several bad deals receives a negative adjustment to warrant and rights fair value. A strong record receives a positive adjustment. With no usable history, no adjustment is made.
Most screeners file a SPAC under a single word. That says almost nothing about what the sponsor is looking for, or whether their team is the one to find it.
One word, for thousands of different strategies.
Every target industry the prospectus names, alongside the sponsor’s strategy, geographic focus and acquisition criteria.
A shareholder meeting is never a single document. Each filing tells part of the story, so each one is tied back to the same event, and the event keeps track of where it stands.
The filings fold into a single record. When one leaves a figure out, another usually carries it, so the facts are merged rather than picked from one filing.
It matters when a SPAC files, not just what. A serial late filer often has trouble elsewhere in the back office — weak controls, accounts that need restating. None of it is fatal alone, but together it’s a quick way to decide whether a SPAC is worth a closer look.
Any one of these changes how the SPAC should be read.
Pressure that builds with time.
Shown with the company’s own account of what happened.
Every figure is kept quarter by quarter, not just its latest value: the trust, redemptions, cash outside the trust, and expenses. A sudden jump in operating costs — lawyers, advisers, due diligence — can mean a deal is close.
| Q1 ’24 | $54K |
|---|---|
| Q2 ’24 | $49K |
| Q3 ’24 | $57K |
| Q4 ’24 | $52K |
| Q1 ’25 | $56K |
| Q2 ’25 | $178K |
Every figure links to the SEC document it came from, so you can verify it before acting on it. And a method has edges worth knowing.
Grades summarise what the filings disclose. A speculative SPAC can close an excellent deal, and an investment-grade one can liquidate. They are not ratings, and not advice.
XBRL tagging varies between filers. Where a figure can’t be read reliably, nothing is shown rather than an estimate, so a blank is never a zero.
Anything the market hears before it reaches EDGAR arrives here afterwards. When a company restates, the record changes with it.
Corrections cited against a source filing are the fastest way to make this better, and they are always welcome.